What Are Moving Averages?

Moving averages are one of the most commonly used tools in technical analysis, and they play a crucial role in understanding market trends. Essentially, a moving average is a calculation that helps smooth out price data over a specific period, making it easier to identify the direction of a trend. By averaging the prices of an asset over a set number of days, such as 10, 50, or 200 days, moving averages filter out short-term fluctuations and provide a clearer picture of the overall market movement.
There are two main types of moving averages: the simple moving average (SMA) and the exponential moving average (EMA). The SMA calculates the average price over a given period, giving equal weight to all data points. On the other hand, the EMA gives more weight to recent prices, making it more responsive to new information.
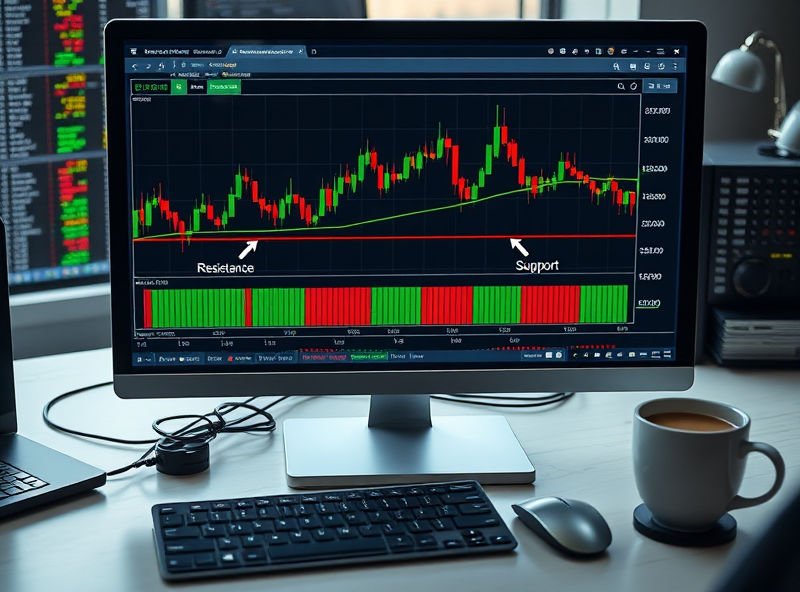
Traders and investors use moving averages to identify potential buy or sell signals. For example, when a short-term moving average crosses above a long-term moving average, it may indicate a bullish trend, while the opposite could signal a bearish trend. Additionally, moving averages can act as dynamic support or resistance levels, helping traders make informed decisions.
By incorporating moving averages into your analysis, you can gain valuable insights into market behavior and make more confident trading or investment choices. Whether you’re a beginner or an experienced trader, understanding moving averages is a fundamental step toward mastering chart analysis.
Using Moving Averages for Trends

Moving averages are a powerful tool for identifying trends in financial markets. By smoothing out price data over a specific period, they help traders and investors filter out short-term fluctuations and focus on the overall direction of an asset’s price. For example, a 50-day moving average calculates the average closing price of an asset over the last 50 days, creating a line that reflects the medium-term trend. When the price of an asset is consistently above its moving average, it often indicates an uptrend, signaling potential buying opportunities. Conversely, when the price stays below the moving average, it may suggest a downtrend, which could be a warning sign for sellers. Combining moving averages of different timeframes, such as the 50-day and 200-day moving averages, can also provide insights into trend reversals or confirmations. This approach is commonly referred to as the ‘golden cross’ (bullish signal) or ‘death cross’ (bearish signal). By incorporating moving averages into your analysis, you can make more informed decisions and improve your ability to spot trends in the market.
Decoding Support and Resistance Levels

Support and resistance levels are fundamental concepts in technical analysis, helping traders and investors make informed decisions. Support levels are price points where an asset tends to stop falling and may reverse direction due to increased buying interest. Think of it as a ‘floor’ that prevents the price from dropping further. Resistance levels, on the other hand, act as a ‘ceiling’ where the price struggles to move higher due to increased selling pressure. Understanding these levels can help you identify potential entry and exit points in the market. For example, if a stock consistently bounces back from a specific price level, that level could be considered strong support. Similarly, if a stock repeatedly fails to break above a certain price, it indicates strong resistance. By combining support and resistance analysis with other tools like moving averages, you can enhance your trading strategy and improve your decision-making process.
Strategies for Chart Analysis Success

When it comes to mastering chart analysis, having a clear strategy is key to success. One of the most effective approaches is combining moving averages with support levels. Moving averages help smooth out price data to identify trends, while support levels highlight areas where prices tend to stabilize. By understanding these two concepts, you can make more informed trading decisions. For instance, when a stock price approaches a strong support level and aligns with a moving average, it could signal a potential buying opportunity. Similarly, observing how prices react to these levels over time can help you anticipate market movements and reduce emotional decision-making. Remember, successful chart analysis is about patience, practice, and continuously refining your strategies based on market behavior.


